
SeismoFK v1.2.1: PMCC Families, Uncertainty, Noise Levels and a Long-Term Batch CLI
Published:
SeismoFK v1.2.1 is out. It is a major update to the open-source infrasound array-analysis application I announced in May. Version 1.2.0 was an interactive FK tool; 1.2.1 adds modern array methods, per-arrival uncertainty, station noise monitoring and a batch processor for records of months or years.

What’s new
PMCC detector with families
A PMCC detector (Cansi, 1995) measures time delays between sensor pairs in several frequency bands and keeps only the delays that are consistent around closed sensor triplets. Consistent time–frequency “pixels” are then grouped into families, one per coherent arrival: pixels join a family when they are adjacent in time and frequency and agree in back-azimuth and trace velocity. The PMCC window shows the band-passed waveform, the correlation of every window (rejected windows in grey as the noise floor), the direction and the trace velocity over the whole span. Each family is shaded and labelled.
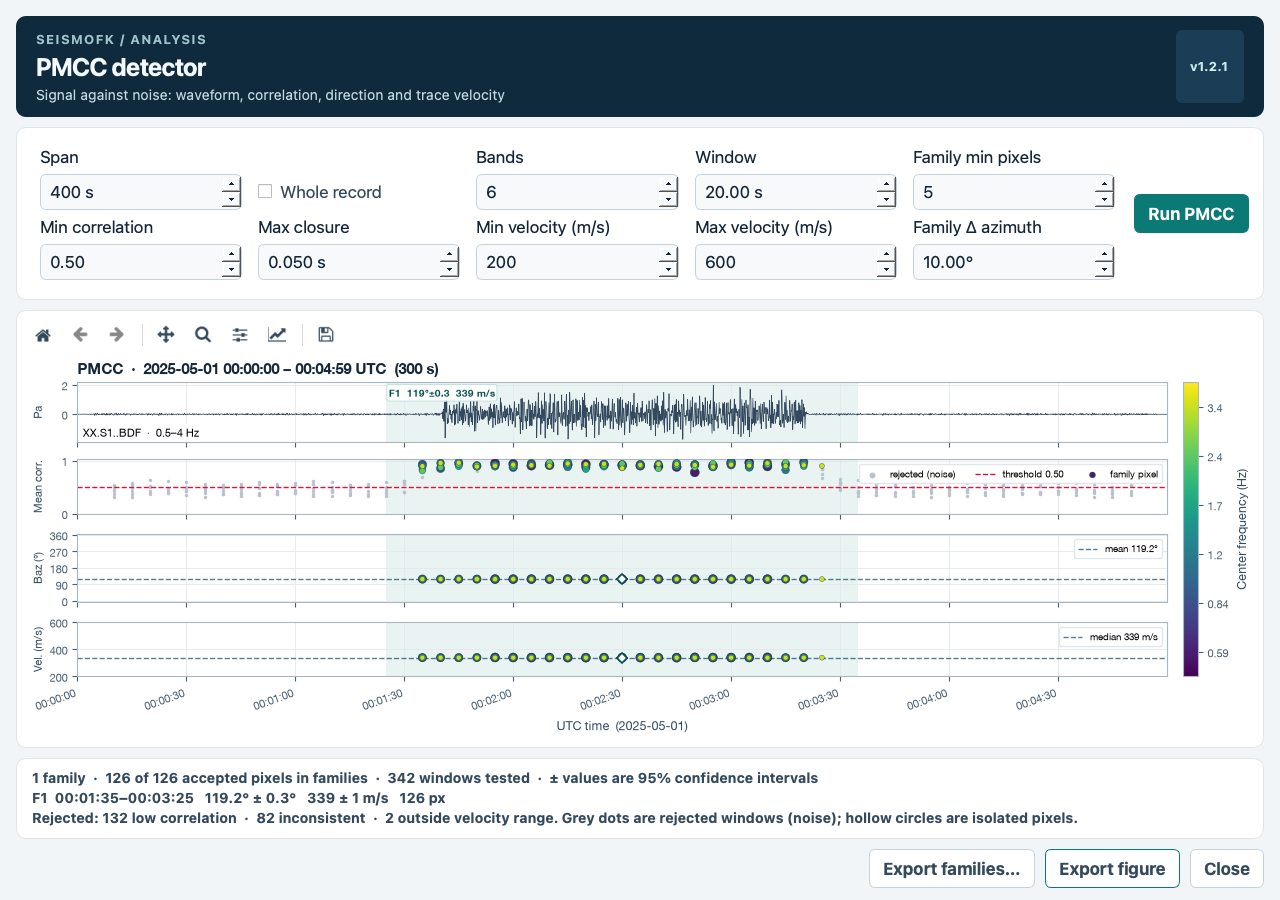 PMCC detector on a synthetic 120° / 340 m/s plane wave: the burst stands out above the grey noise windows.
Uncertainty for every detection
Every PMCC pixel and family now carries a 95% confidence interval for back-azimuth and trace velocity. The intervals come from an arrival-time error model that accounts for the array geometry and has a Cramér–Rao floor. Families in which the direction changes, which usually means two sources merged, are flagged. On 180 noisy synthetic plane waves the family intervals contained the true values 98–100% of the time. They haven’t yet been validated against ground-truth field events.
The FK results window reports a moving-block bootstrap with percentile intervals. Overlapping FK windows are correlated, and intervals are never narrower than the slowness-grid resolution.
Noise levels in dB re 20 µPa
A new Noise levels tool computes the RMS level of every sensor in consecutive windows (seconds to an hour) over the whole record, in dB re 20 µPa. It reports the acoustic statistics L90 / L50 / L10 and Leq (a power average), shows medians by hour of day to reveal the wind cycle, and compares every sensor with the median of the others. An offset of 3 dB raises a warning and 6 dB (a factor of two in pressure) a fault, which catches gain and metadata errors, faulty wind-noise reducers or dead sensors.
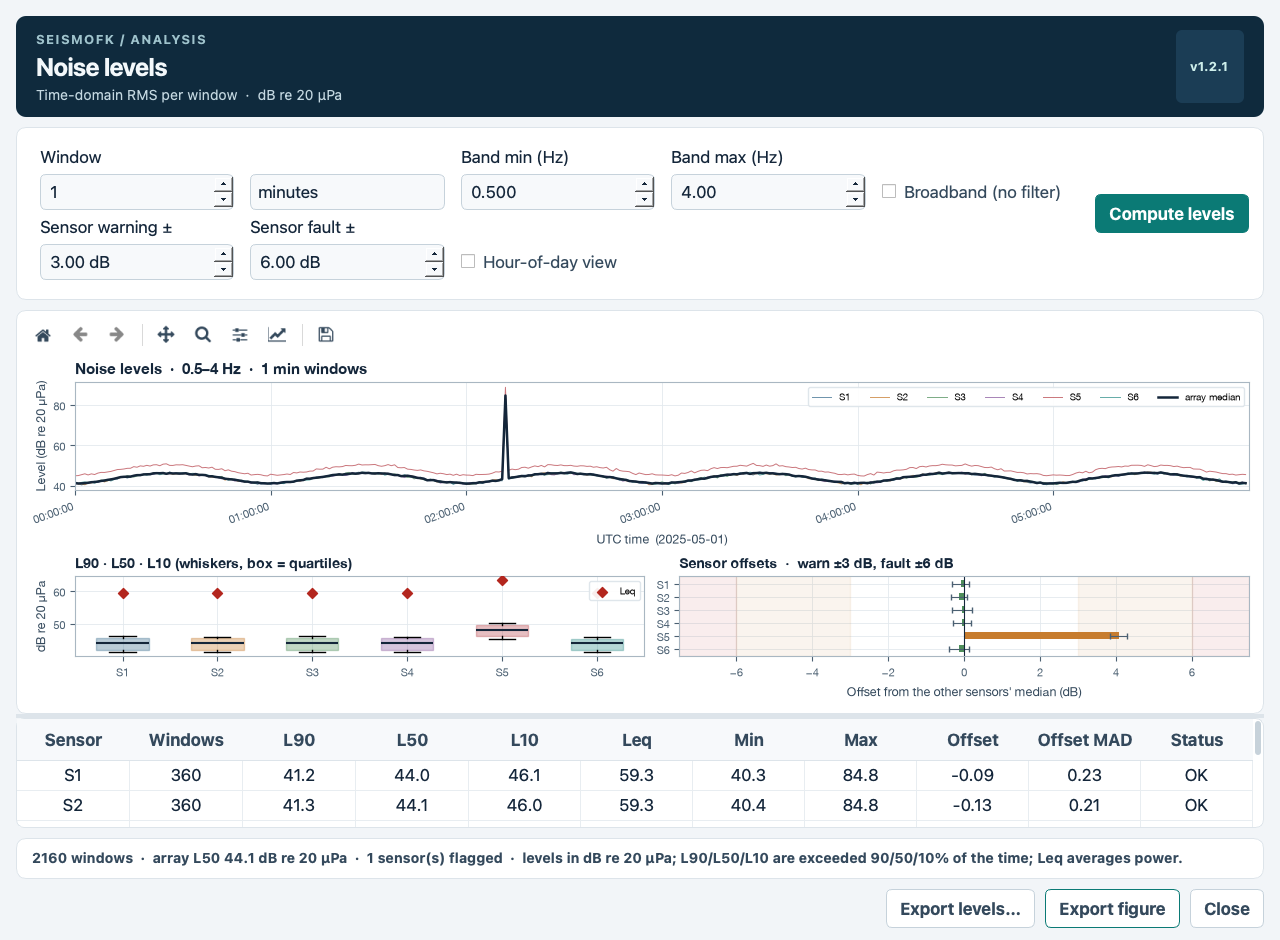 Noise levels in 1-minute windows over six synthetic hours with a gusty wind cycle: sensor S5 has a simulated +4 dB gain error and is flagged.
High-resolution beamforming
Capon (MVDR) and MUSIC slowness maps sit alongside conventional Bartlett FK, together with the theoretical array response of the current geometry.
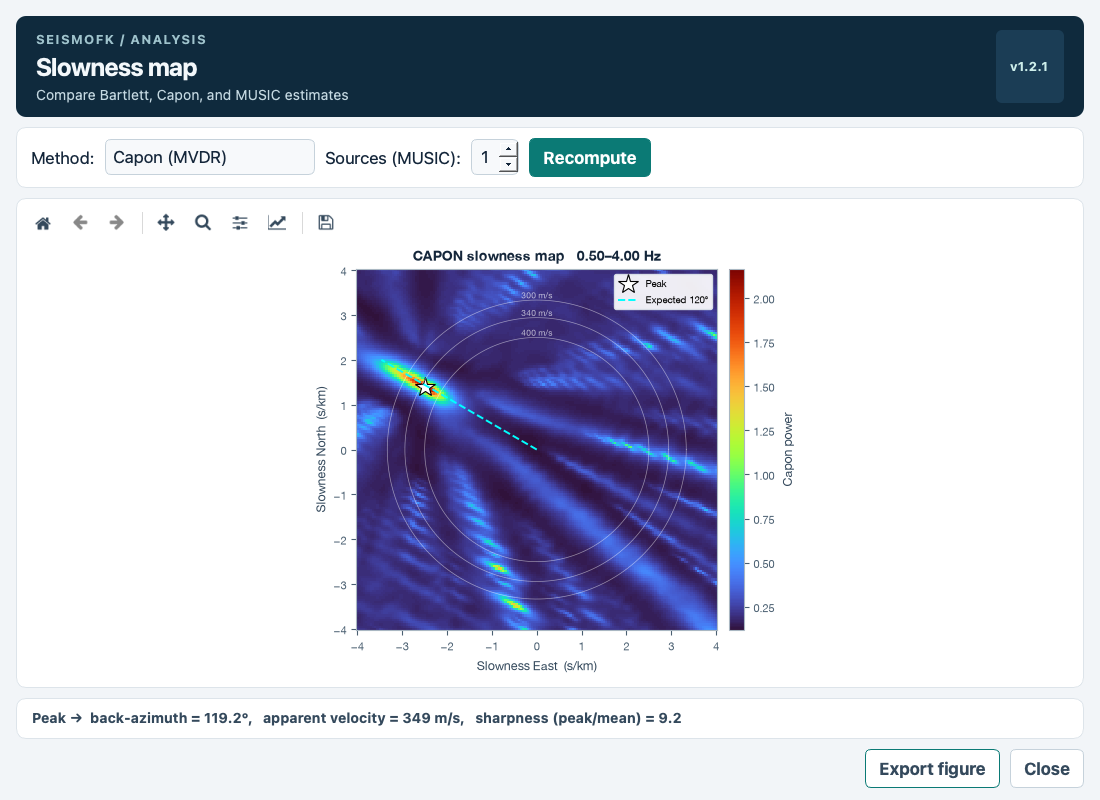 Capon slowness map for a synthetic 120° / 340 m/s plane wave.
A batch CLI for long-term monitoring
seismofk-cli processes arbitrarily long records chunk by chunk with bounded memory, using the same methods as the GUI: fk, bartlett, capon, music, pmcc and noise. Results are archived as Parquet tables with a JSON metadata file and an index.csv row for every chunk (status, calibration units, gap fraction). With --save-figures it also writes a figure per chunk and a whole-run summary, without needing a display.
seismofk-cli --mseed "data/*.mseed" --inventory XML_IM/I48TN.xml \
  --start 2026-06-01 --end 2026-07-01 --method pmcc \
  --fmin 0.5 --fmax 4 --array-name I48 --out-dir results/ --save-figures

seismofk-cli --mseed "data/*.mseed" --inventory XML_IM/I48TN.xml \
  --start 2026-06-01 --end 2026-07-01 --method noise --noise-window 300 \
  --array-name I48 --out-dir noise/ --save-figures
Safer metadata handling
Some IMS StationXML inventories contain overlapping channel epochs, so a nominal calibration covers the same dates as the real one. For I48 in 2026, blindly taking the first epoch would put pressure amplitudes 21–28% too low. SeismoFK now resolves each channel to its most recent calibration and reports the choice. A data-readiness check flags collinear arrays, bands above Nyquist, missing coordinates and gaps before any analysis runs. The repository now also ships StationXML inventories for the IMS infrasound arrays in XML_IM/.
A redesigned interface
Every window now shares one theme with the platform UI font. The waveform explorer uses a UTC time axis and shades the analysis window, and FK, PMCC, noise and spectrogram results can be exported as publication-quality figures.
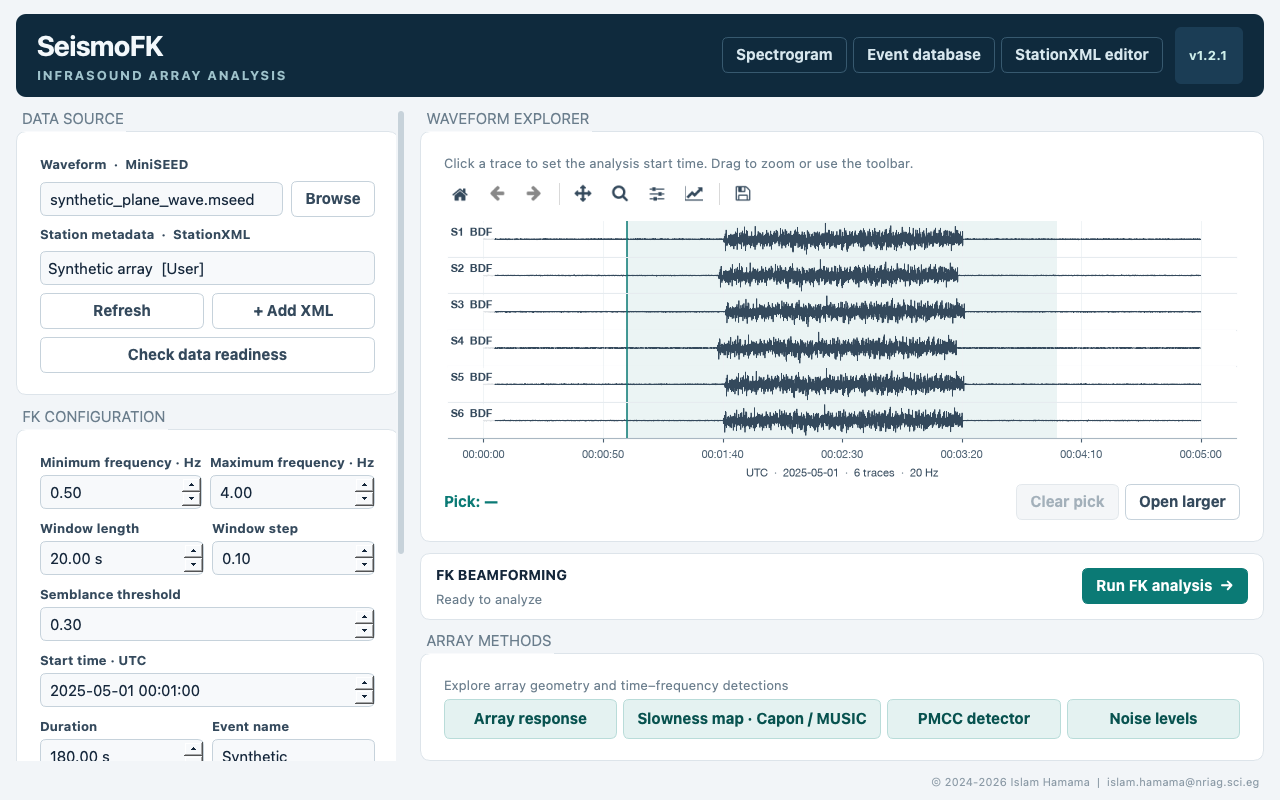 The main window: data source and FK settings on the left, the waveform explorer with the analysis window shaded, and the array methods below.
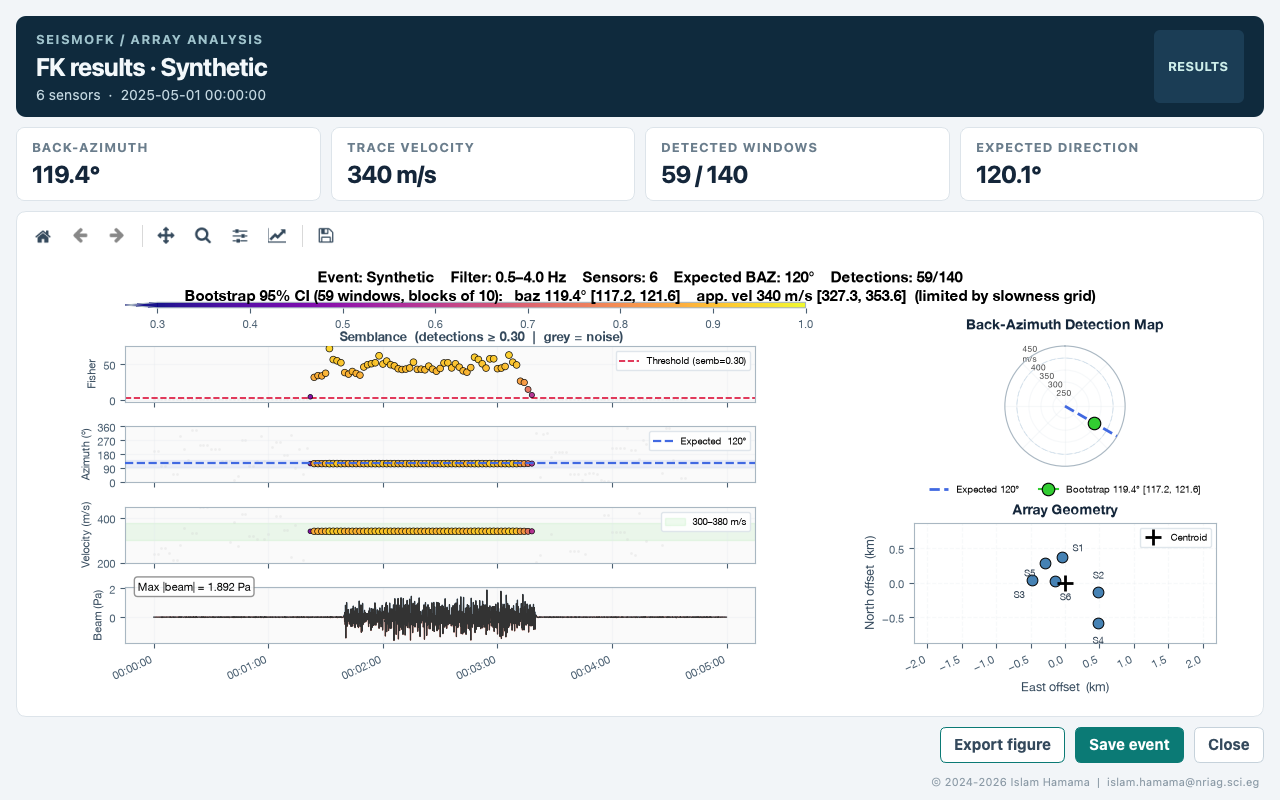 FK results window with bootstrap 95% intervals, the polar detection map and the array geometry.
Get it
- Release: github.com/islam-hamama/SeismoFK/releases/tag/v1.2.1
- DOI (all versions): 10.5281/zenodo.20301795
- License: MIT
- Install:
git clone https://github.com/islam-hamama/SeismoFK.git
cd SeismoFK
python -m venv .venv && source .venv/bin/activate
pip install -e ".[parquet]"
seismofk          # desktop application
seismofk-cli -h   # batch processing
Citation
Hamama, I. (2026). SeismoFK [Computer software]. Zenodo. https://doi.org/10.5281/zenodo.20301795
Feedback, bug reports and feature requests are welcome. Please open an issue on the GitHub repository or email islam.hamama@nriag.sci.eg.